


Industrial CT Scanning Composite Materials for Density Variation
DR & CT for Linear Density
Industrial Computed Tomography is used to locate and understand variations in linear density and defects within composite materials. Our client had a six month bottle neck of composite boards needing CT analysis. We developed an x-ray based imaging solution to avoid CT cycle time, solve data management, eliminate processing required by CT, and reduce cost.
Sample CT Dataset
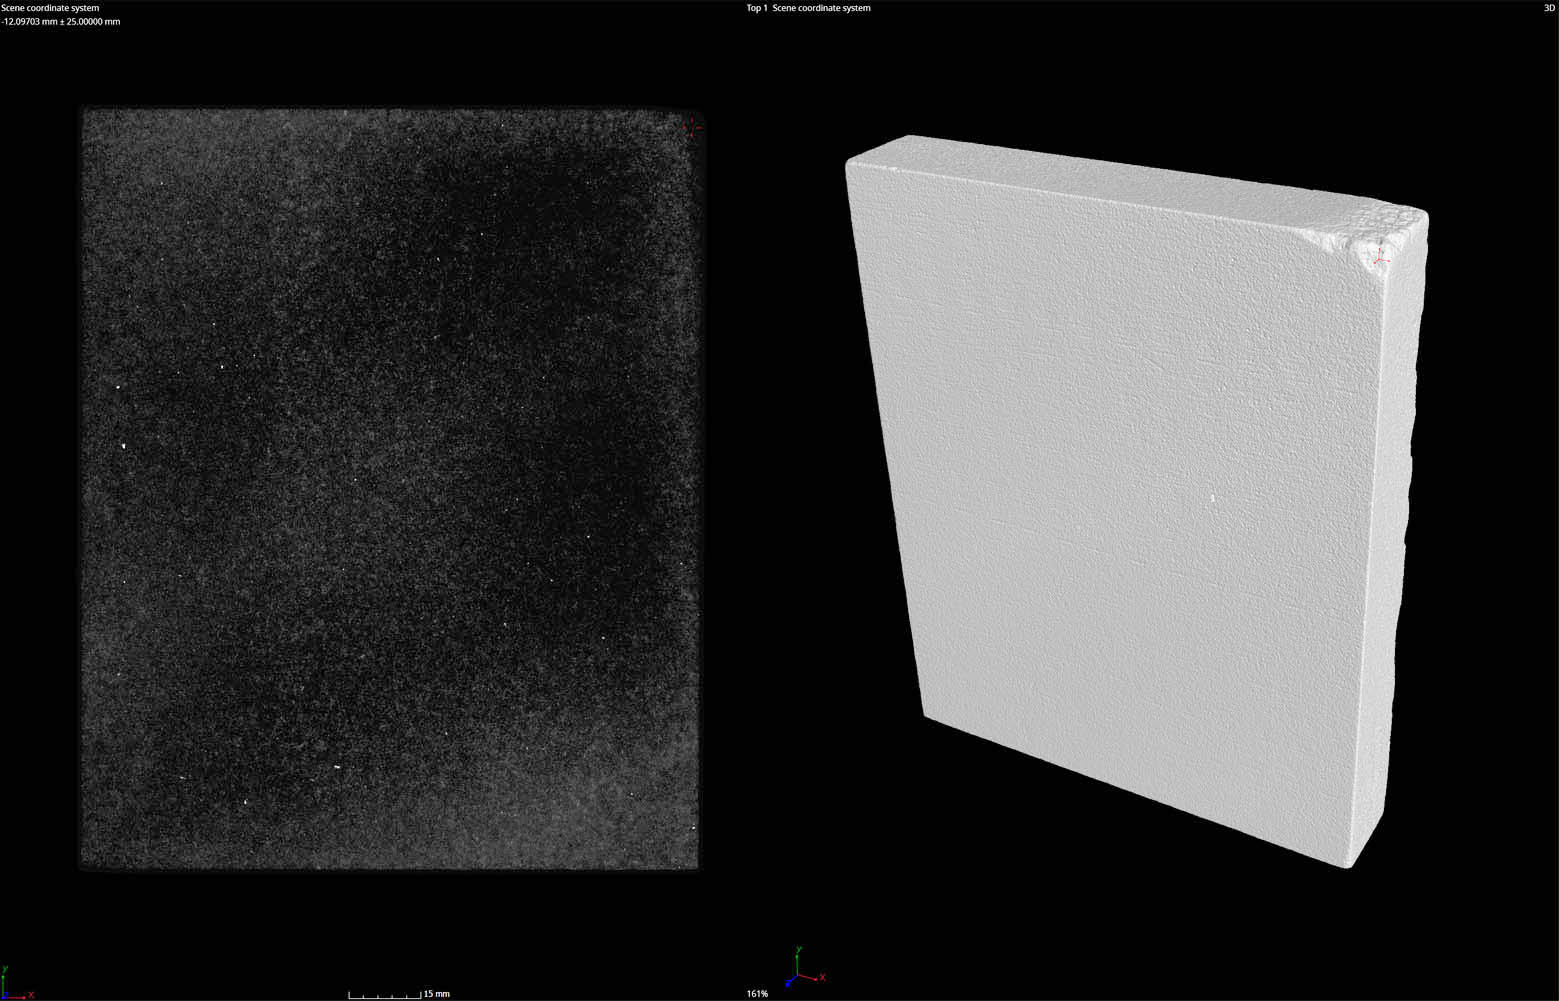
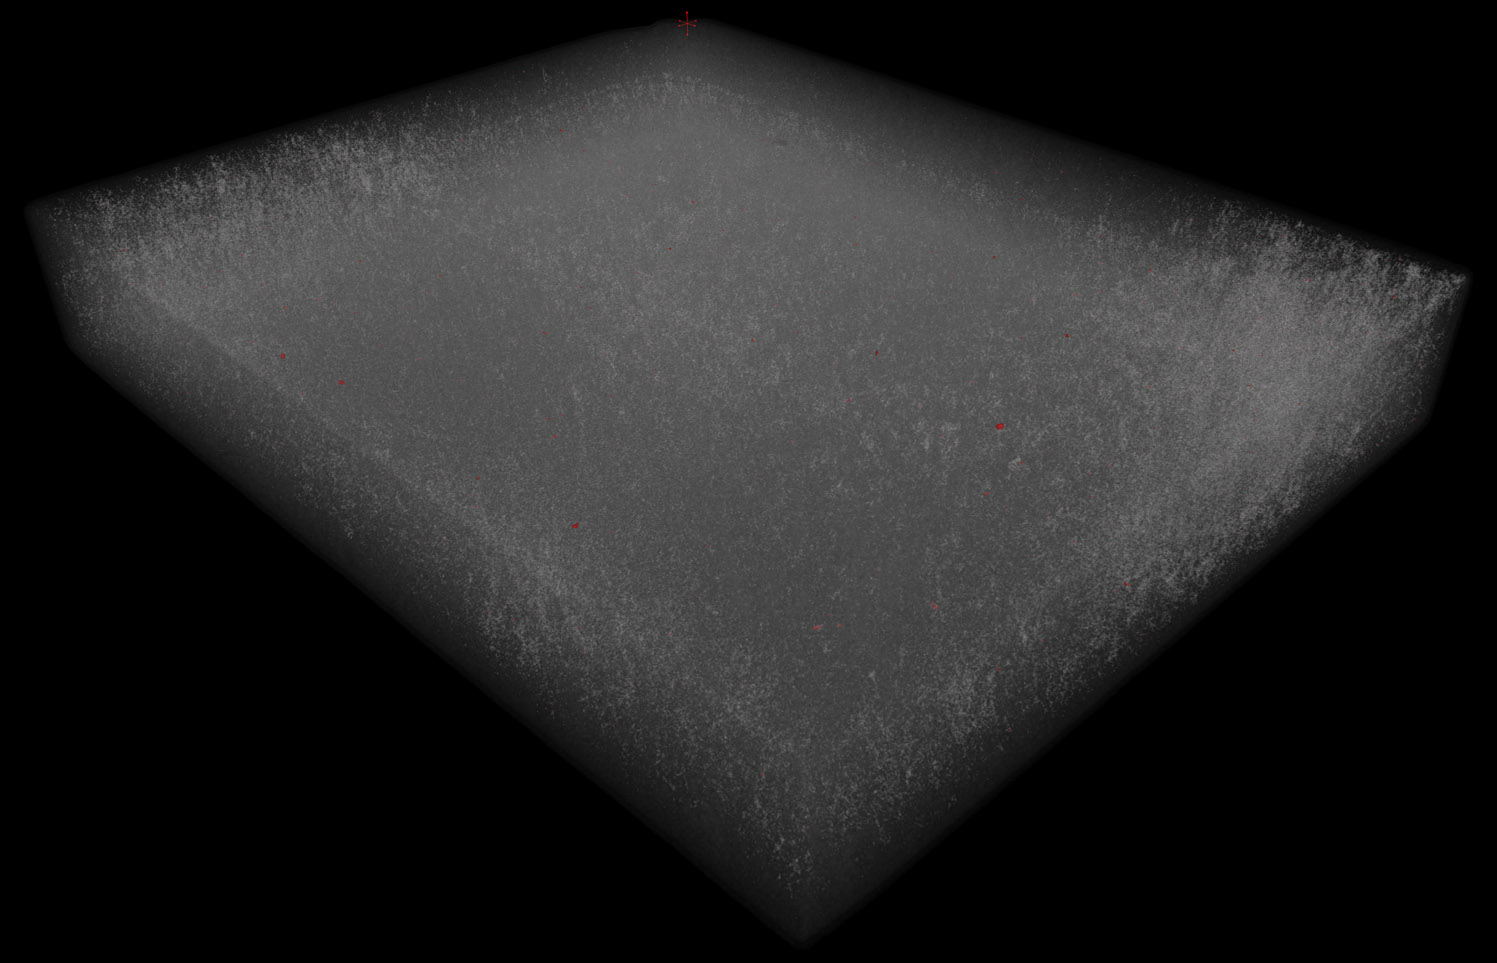
We first performed a CT scan on a 6×7 inch sample sectioned from a 18×24 inch board to verify that our equipment could reproduce data our client was already receiving. The CT scan demonstrated this ability; the images below show inclusions and variations in linear density. Light clouding indicates higher relative density, and comparatively dark clouding indicates lower relative density. White or red specks are inclusions. The second image shows a rendering style that accentuates this density variation.
Establishing a Baseline
After proving we could produce the same type of CT results we needed to set a baseline on a full panel. Linear density is the term we use to associate how much energy is required to pass through on object. For example, it takes less energy to pass through aluminum wall stock than it does to pass through that same wall stock with another component welded to it a quarter inch over. More material requires more energy.
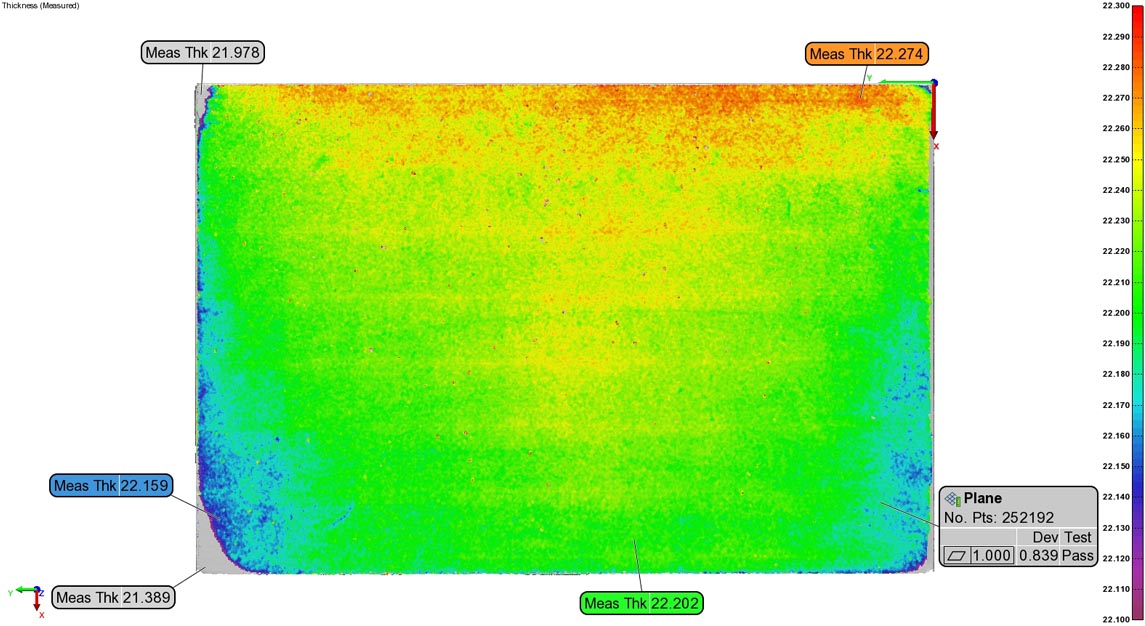
The sensitivity required to analyze this linear density on a thin composite board means any variation in material thickness could affect our results. If a different location on the board had .1mm more material it could lead us to believe that location actually has higher density. We used our Zeiss surface scanner to scan the exterior of the board, and then used PolyWorks to measure the thickness. This is also an important step in order to calibrate the CT settings and associate X-Ray gray values with sample thickness; we use the same x-ray parameters for each sample and use the master part to associate and verify a certain color with a known thickness.
Quantifying Linear Density Variation
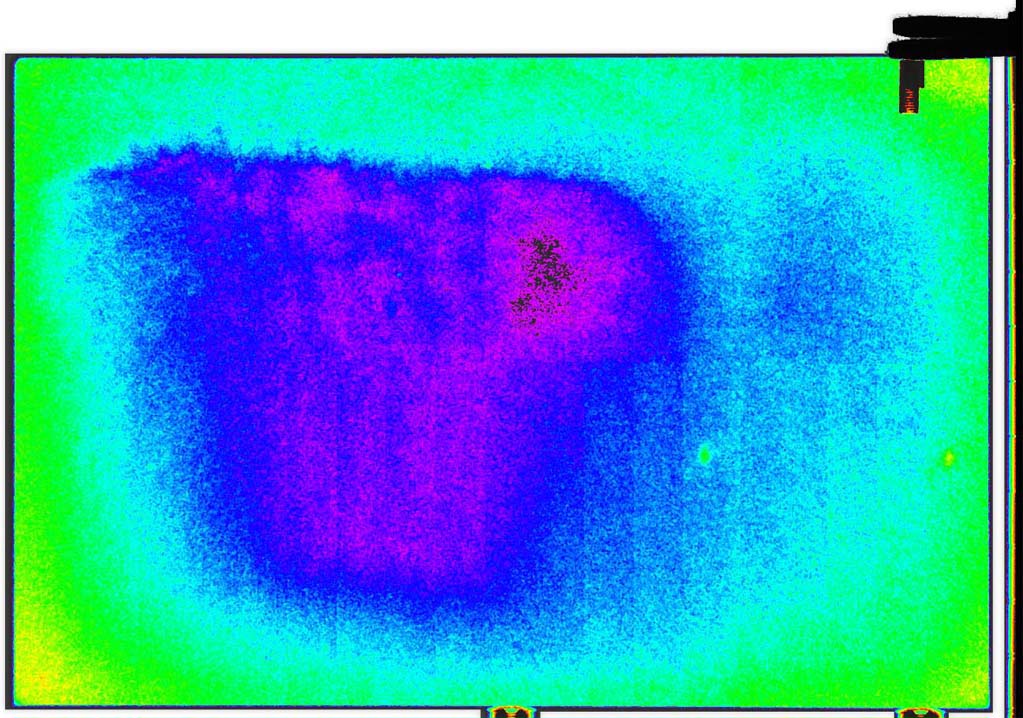
Below shows a compiled 2D Radiography image in Pseudo-Color. The variations in color represent the amount of energy required to pass through the composite board. There was no correlation between material thickness and linear density at this level of detection.
We were concerned that at this level of sensitivity defects in shading correction or detector imperfections would influence results. However, when we moved the sample inside, and flipped the board upside down, the pattern of deviation followed accordingly. There was evidence of some target spatter on the source window (green spot inside light blue in the center of the image.) This gave us further confidence by being able to detect known system imperfections.