


Calibrated DR & CT Correlation
Factors of Resolution
The first question we typically receive from new clients is what level of resolution they can expect. For many reasons this question is complex and difficult to answer. The two primary factors that affect resolution include:
1. Size of part or area of interest (geometric magnification)
2. Material density (necessary contrast for effective imaging)
These part conditions determine the most effective parameters for a given sample. Resolution is dependent on proximity to the x-ray source (bigger parts must be imaged further away), and focal spot size increases with power (contrast for high density materials requires more current.)
For this integrated circuit we imaged with our static reflection target at this configuration’s best possible resolution – 3um. While we have a transmission target capable of 1um resolution, reflection is standard.
The larger and more dense the part, the lower the resolution. Without technique development we can only offer approximations of resolution.

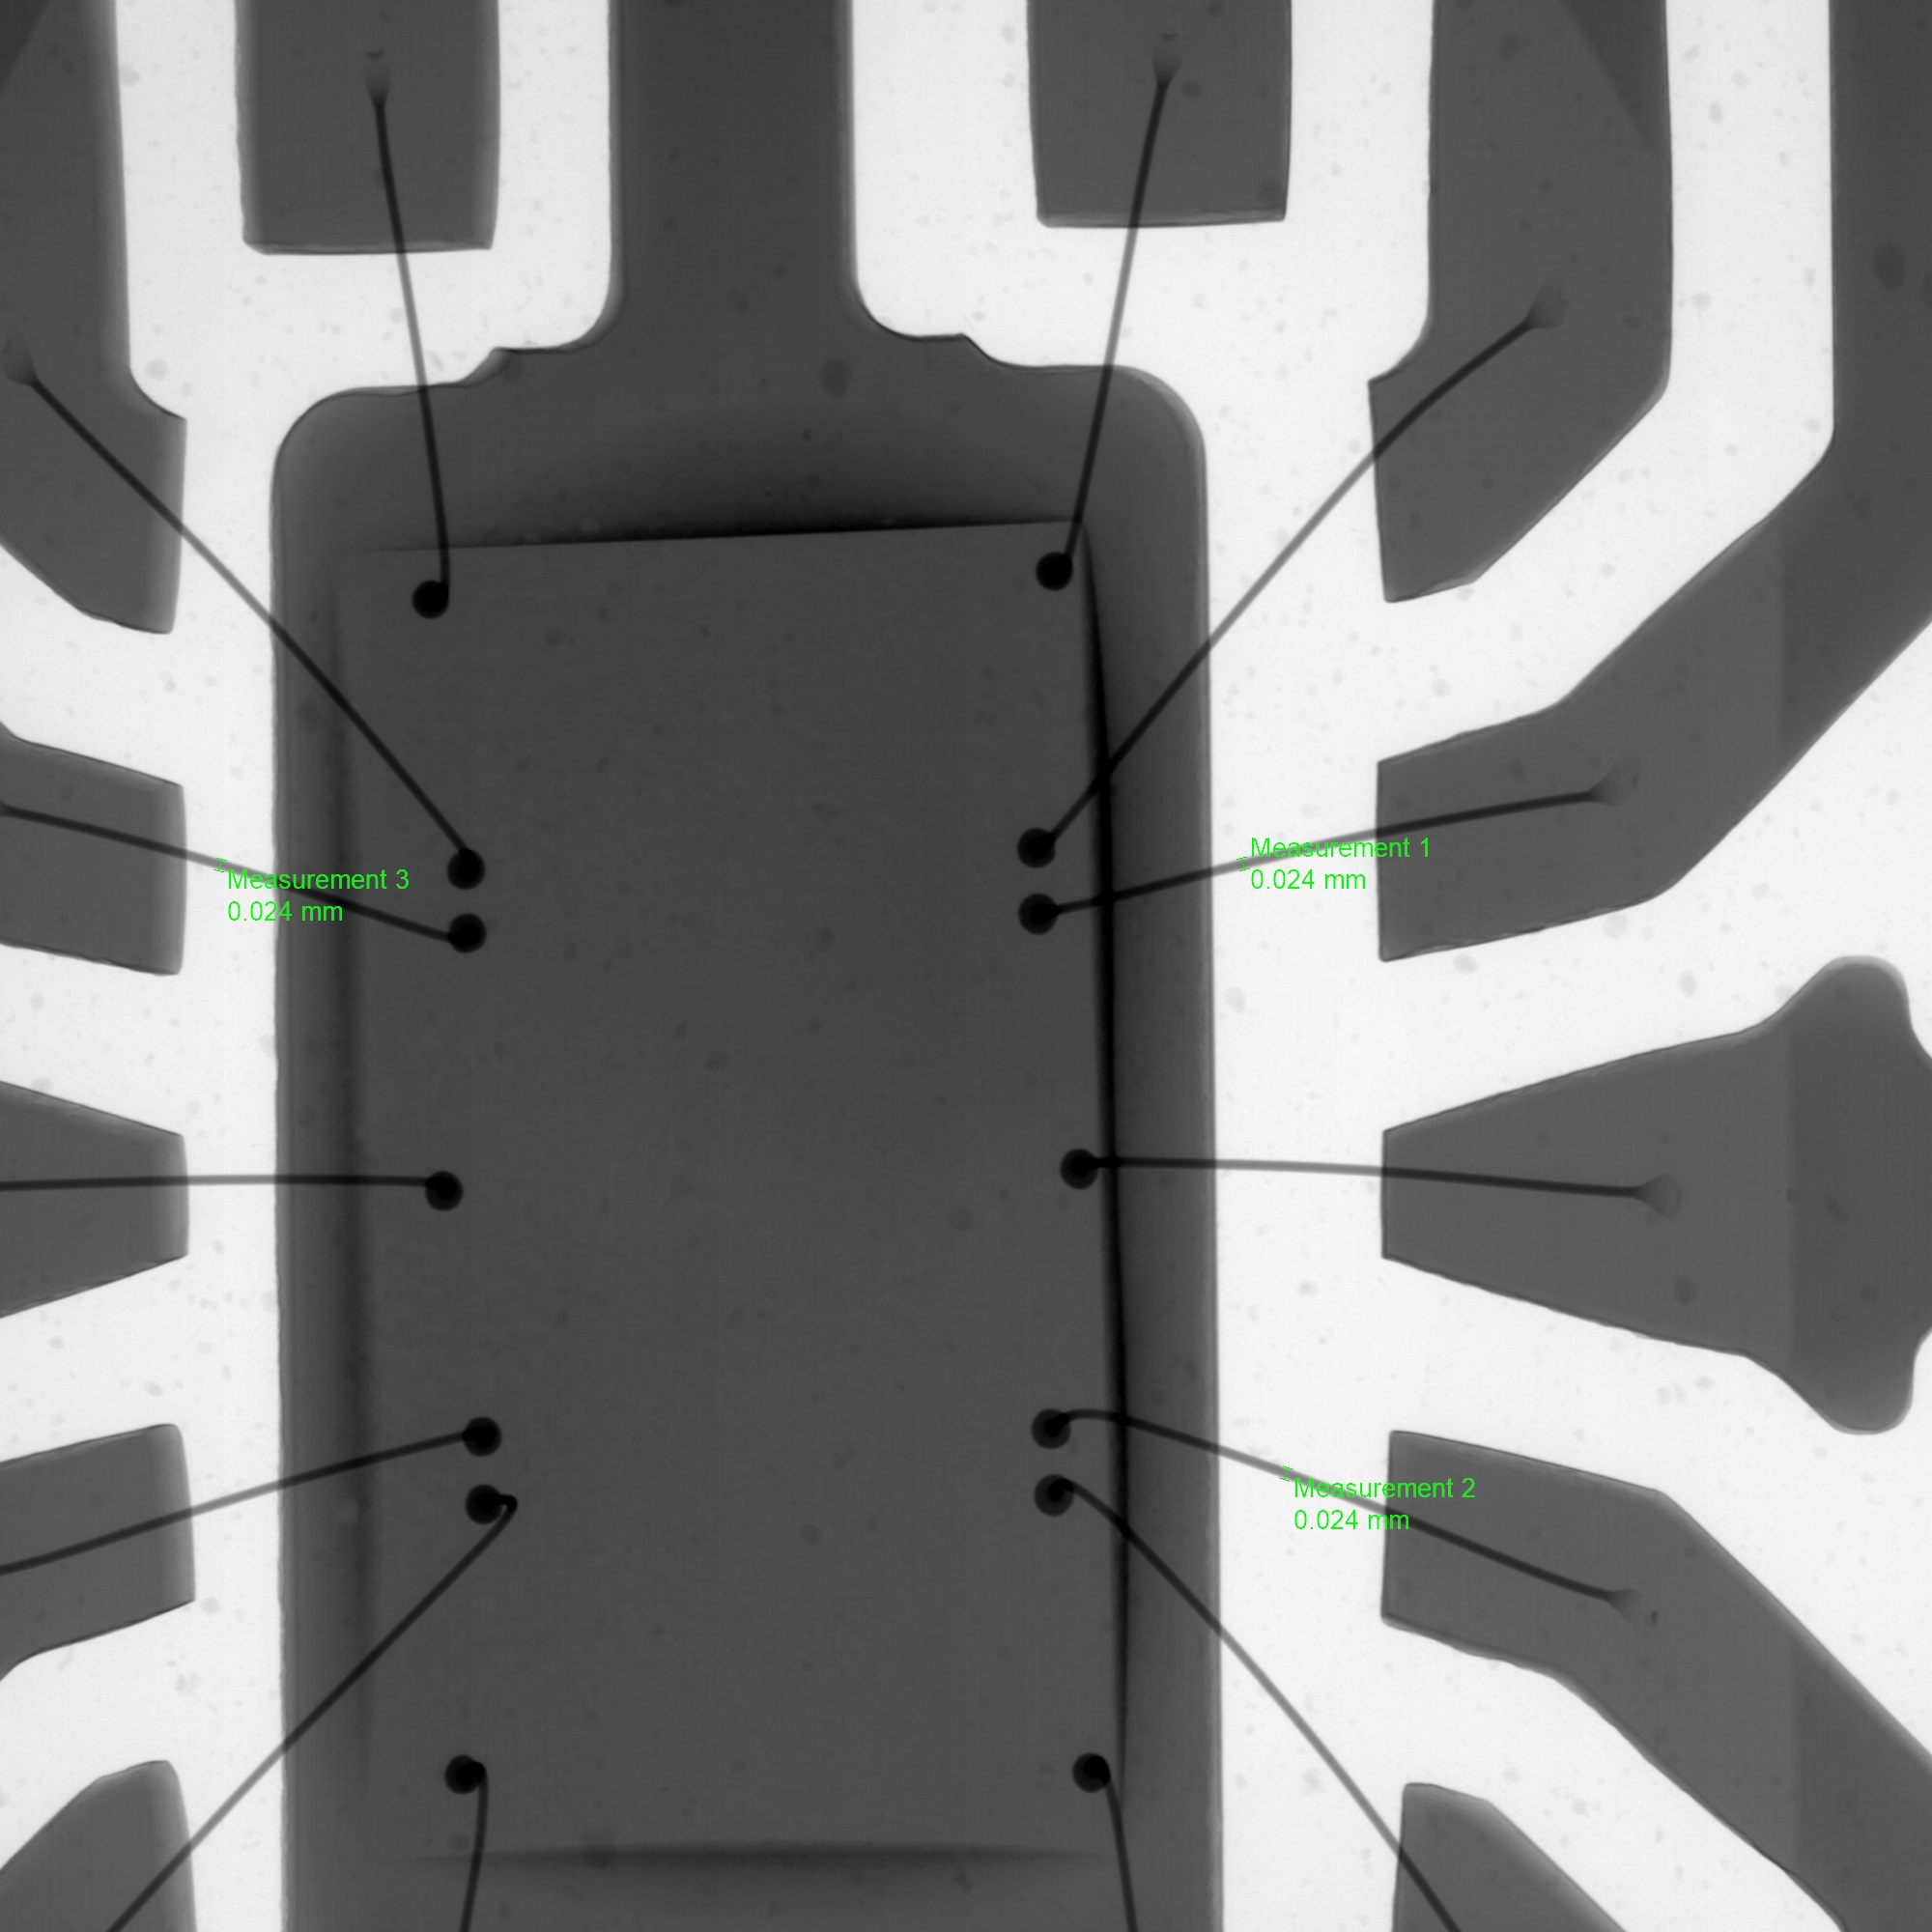
Digital Radiographic Image of Integrated Circuit
This DR image is the result of the best optimization of the IC component in our system. Frame averaging was used to reduce noise. Then, linear measurements were applied during image processing.
We use a variety of gauges (IQIs, step wedges, spatial resolution adjustment bars), tools (software based tuning and adjustments), and methods (multi-system correlation studies) to calibrate these measurements, and our system is calibrated multiple times a year. Due to part complexity not all factors can be controlled in radiographic views compared to what we are used to on more traditional dimensional inspection devices.
The 2D diameter of each of three bond wires measures at 24 microns.

Raw Images Available
The presented images have been reduced for web optimization. Here are the links to the raw images. The DR image has been converted to .jpeg from .tif so it is still lossy.
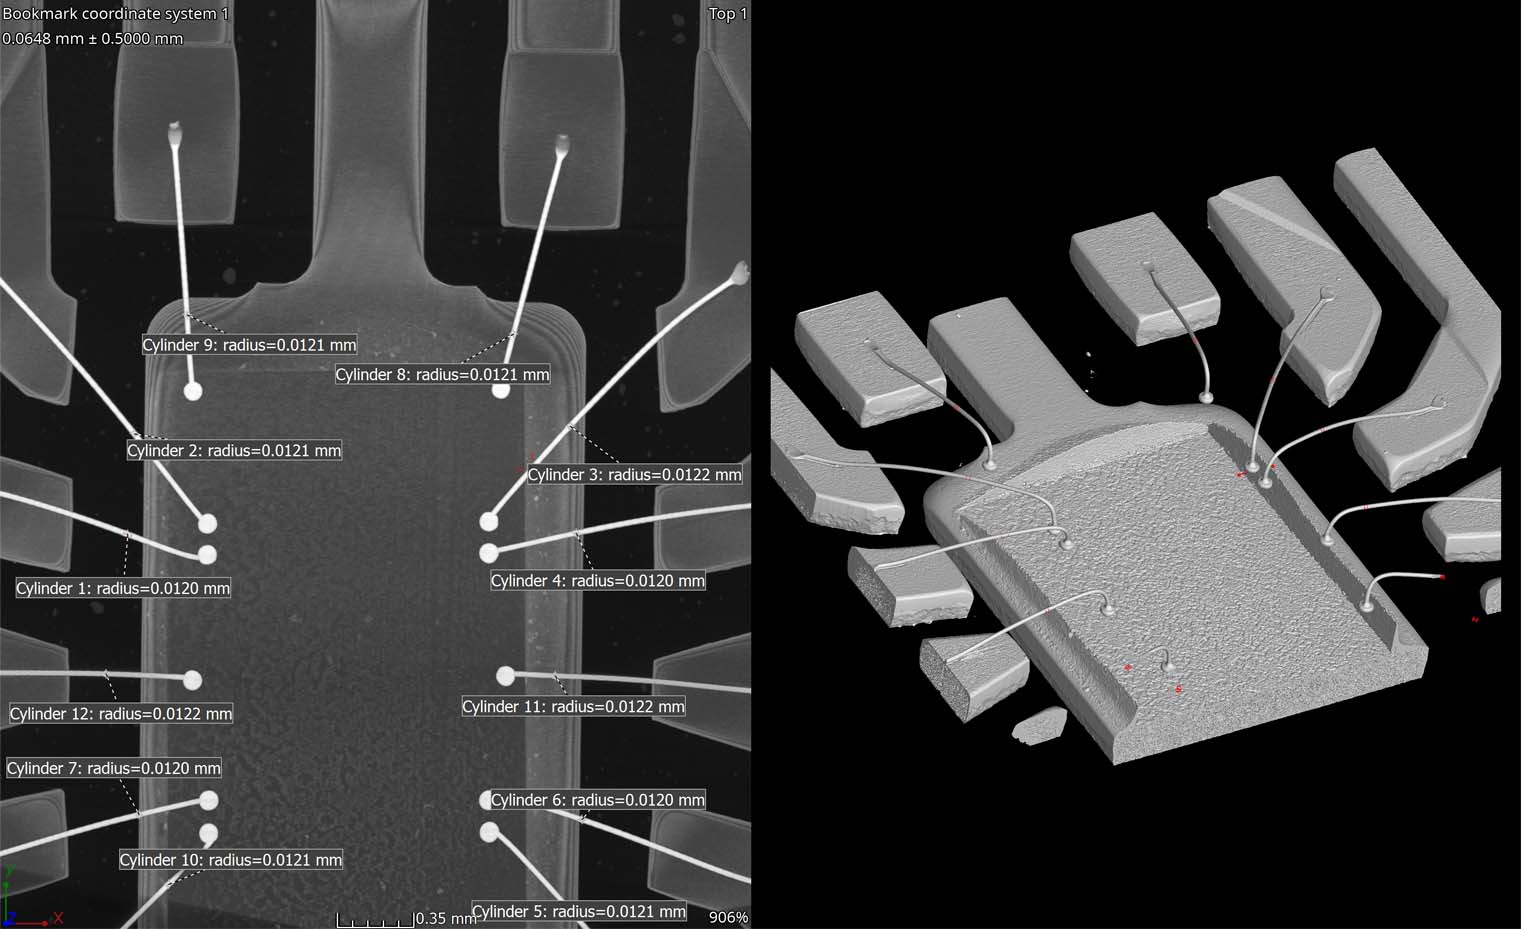
Correlation of DR & CT Methods
All non-referential measurements require calibration. We use certified ball bars with known center to center distances to calibrate each scan. Even non-certified scans receive high certainty measurements from the FID/FOD calibration of the entire system using the same ball bar method.
The IC is much smaller than our smallest calibration artifact, so in this scenario we rely on the overall system calibration which interpolates the resolution adjustments to every level of magnification.
The result of these calibrations and effective techniques is sub-micron correlation between Digital Radiography & Computed Tomography. The Volume Graphics based feature extractions from wire to wire had a range of .0002mm (1/5th of a micron)!

